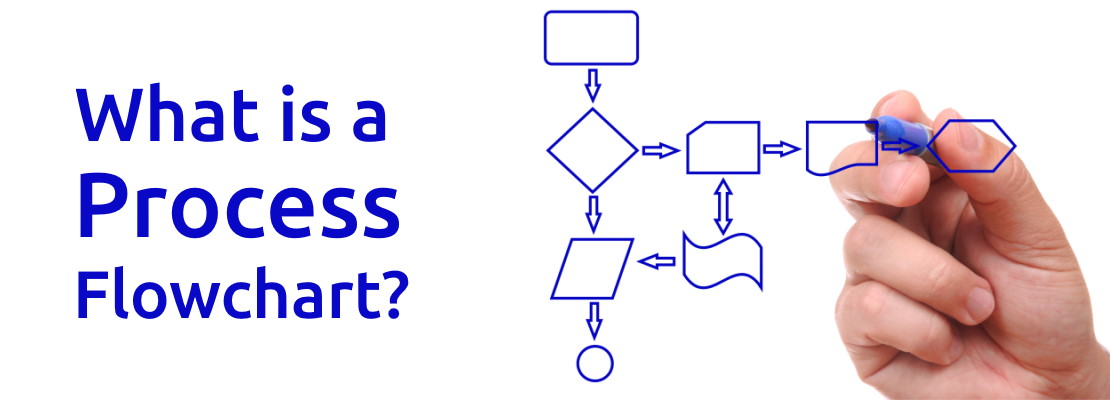
A process flowchart is a diagram that shows the steps of a business process in the order they happen, using a small set of standard symbols for actions, decisions, inputs and outputs. It answers three questions on one page: what happens, in what order, and what happens when the answer at a decision point is "no". If you have ever tried to explain how a purchase order gets approved and found yourself saying "well, it depends", a flowchart is the tool for pinning down what it depends on.
Flowcharts are not new. Frank Gilbreth presented the first "process charts" to the American Society of Mechanical Engineers in 1921, and the symbol set most people recognise today was standardised as ISO 5807 in 1985. The reason they have outlasted every management fad since is that they force precision. You cannot draw a decision diamond without naming the condition. You cannot draw an arrow without deciding where the work goes next. Vague processes cannot be flowcharted, which is exactly why flowcharting is useful.
This guide is for operations, IT, HR and team leads who need to document a process well enough that other people can follow it, improve it, or build it into software. By the end you will know the symbols, the five main flowchart types, when a flowchart is the right tool (and when a checklist or an SOP is better), an eight-step method for drawing one, five fully worked examples, and how to turn a finished flowchart into a checklist that actually runs.
What Is a Process Flowchart?
A process flowchart is a visual model of a single process, read from a defined start to a defined end. Each box is a step someone or something performs. Each diamond is a question with two or more possible answers. Each arrow is the path the work takes. The whole point is to represent the process as it is actually performed, not as the policy manual says it should be.
Flowcharts sit inside a larger discipline. Business process mapping is the activity of discovering and documenting how work moves through an organisation; a flowchart is the most common output of that activity. Business process modelling goes further, adding formal notation, data and timing so the model can be simulated or executed. And all of it rests on the basic idea of a process: a repeatable sequence of activities that turns an input into an output somebody values.
What distinguishes a process flowchart from a general diagram is that it has exactly one entry point, at least one exit point, and every path between them is traceable. If you can put your finger on the start symbol and follow arrows to an end symbol without ever being stuck at a box with no way out, the chart is complete. If you cannot, you have found either a drawing error or, more usefully, a gap in the real process.
Definition
A process flowchart is a diagram that represents the sequence of steps, decisions and hand-offs in a business process using standard symbols connected by directional arrows. It shows what happens, who does it (in swimlane form), and which path the work follows at each decision point.
Why teams draw them
In practice, flowcharts get drawn for four reasons, and it helps to know which one you are doing before you start.
To agree what the process is. Three people who all "know" the expense approval process will describe three different processes. Drawing it in a room together surfaces the differences in an hour. This is the most common and most valuable use, and it is the reason the first draft should always be done with the people who do the work, not for them.
To find waste. Once the process is on a page, loops, duplicate approvals and steps that exist only because "we've always done that" become visible. A flowchart with three separate points where the same manager is asked to approve the same request is a flowchart telling you something. For a more quantitative version of this exercise, value stream mapping adds cycle time and wait time to each step.
To train. A new starter can absorb a one-page flowchart of the incident escalation process faster than a twelve-page procedure. The flowchart gives them the shape; the procedure gives them the detail when they need it.
To build. If the process is going to be implemented in software, whether that is a ticketing tool, a BPM platform or a checklist with conditional branches, the flowchart is the specification. Every diamond becomes a rule; every box becomes a task.
Process Flowchart Symbols
Flowcharting has dozens of symbols in the full ISO 5807 set, and you will need about eight of them. Using more does not make a chart more precise; it makes it harder for the people who have to read it. The table below covers the symbols that appear in almost every business process flowchart, what each one means, and the mistake most often made with it.
| Symbol | Shape | Meaning | Common misuse |
|---|---|---|---|
| Terminator | Rounded rectangle (pill) | The start or end of the process. Label with the triggering event ("Ticket received") or the final state ("Ticket closed"). | Labelling the start "Start". It should name the trigger, otherwise nobody knows what kicks the process off. |
| Process | Rectangle | A single action or task, written as verb plus object: "Verify invoice total", "Create user account". | Cramming three actions into one box. If the box needs the word "and", it is probably two boxes. |
| Decision | Diamond | A question with two or more mutually exclusive answers. Every outgoing arrow must be labelled with an answer. | Unlabelled arrows, or questions that are not really binary ("Is it OK?"). |
| Input / Output | Parallelogram | Data or material entering or leaving the process: "Receive purchase request form", "Send approval email". | Using it for every step that involves a computer. It is for things crossing the process boundary. |
| Document | Rectangle with wavy bottom edge | A document is produced or consulted: "Generate PO", "Check signed contract". | Drawing every email as a document. Reserve it for artefacts that persist. |
| Connector | Small circle (on-page) or pentagon (off-page) | Jumps the flow to another point on the page, or to another page, to avoid crossing lines. | Using so many that readers spend more time hunting for matching letters than reading the process. |
| Sub-process | Rectangle with double vertical edges | A step that is itself a whole process documented elsewhere: "Run background check (see HR-07)". | Hiding the hard part of the process inside a sub-process box that nobody has actually drawn. |
| Swimlane | Horizontal or vertical band | A row or column that groups all steps performed by one role, team or system, so hand-offs are visible. | Lanes named after people rather than roles, so the chart is out of date the day someone changes job. |
Two conventions make charts dramatically easier to read. First, flow runs top to bottom or left to right, and never doubles back except for an explicit loop (a rejected request returning to the requester, say). Second, the "happy path", the sequence that happens when every decision goes the expected way, runs straight down the middle. Exceptions branch off to the side. A reader should be able to follow the main line of the chart with one finger and understand the ninety per cent case before they look at any branch.
Types of Process Flowchart
"Flowchart" covers a family of diagrams that share symbols but differ in what they emphasise. Picking the wrong type is a common reason a chart gets drawn, admired and never used. Here are the five you will meet, and what each is for.
Basic flowchart
One process, one perspective, no lanes. Start at the top, follow the arrows, finish at the bottom. This is the right choice when a single person or team performs the whole process, or when you are sketching a first draft in a workshop and want to get the sequence agreed before you worry about who does what. Most SOP illustrations are basic flowcharts.
Swimlane flowchart
Also called a cross-functional flowchart or a Rummler-Brache diagram, after the consultants who popularised it in the late 1980s. The page is divided into lanes, one per role, department or system, and each step sits in the lane of whoever performs it. Every time an arrow crosses a lane boundary, that is a hand-off, and hand-offs are where processes lose time, information and accountability. If your process involves more than one team, draw it as a swimlane. It is the single most useful flowchart type for business processes, and it is the format that translates most directly into a checklist with task assignment.
Workflow diagram
A workflow diagram looks like a flowchart but concentrates on the routing of a work item, a document, ticket or request, between people and states, rather than on the detail of what each person does. It is the natural way to describe an approval chain or a ticket lifecycle. The distinction between a workflow and a process is subtle but worth understanding; what is a workflow covers it properly.
Data flow diagram
A data flow diagram (DFD) models where information comes from, where it is stored and where it goes, and deliberately ignores sequence. It uses different symbols (circles for processes, open rectangles for data stores) and is the right tool when the question is "which system holds the customer's address and who updates it?" rather than "what happens next?". IT and integration teams use them heavily; operations teams rarely need them.
BPMN diagram
Business Process Model and Notation, maintained by the Object Management Group, is a formal standard with a much larger symbol vocabulary: events, gateways, message flows, timers, compensation. Version 2.0 (2011) added an execution semantics, meaning a compliant BPMN model can be run by a process engine. BPMN is what you use when the process will be automated in a BPM suite, or when you need a model precise enough to simulate. For a process that a human team is going to follow, it is usually more notation than the readers can absorb. Business process modelling covers BPMN and its alternatives in depth.
Which type should you draw?
One team, one page: basic flowchart. More than one team or system: swimlane. Tracking a request through approval states: workflow diagram. Working out where data lives: data flow diagram. Feeding a process engine or simulation: BPMN. When in doubt, start with a swimlane; it is the type most operations teams end up with anyway.
Flowchart vs Checklist vs SOP: When to Use Which
A flowchart, a checklist and a standard operating procedure are three different documents that describe the same process, and teams waste a lot of effort trying to make one of them do the job of the other two. A flowchart shows the shape. An SOP explains each step in enough detail to perform it. A checklist is the thing you actually tick off while doing the work. Mature teams keep all three and keep them consistent.
| Process flowchart | SOP | Checklist | |
|---|---|---|---|
| Answers | What happens, in what order, and which way the work goes at each decision | Exactly how to perform each step, with acceptance criteria and reasons | Was each step done, by whom, and when |
| Best for | Agreeing the process, finding waste, training, specifying software | Reference while performing an unfamiliar or regulated task | Executing the process, every time, with a record |
| Handles branching | Natively; it is what diamonds are for | Awkwardly, via "if X, go to section 4.2" | Only with conditional logic in checklist software |
| Level of detail | Low: one line per step | High: paragraphs, screenshots, tolerances | Medium: one instruction per item, links out for detail |
| Produces a record | No | No | Yes, if run in software; no, if printed |
| Typical length | One page | Three to fifteen pages | Ten to forty items |
| Who reads it | Managers, analysts, new starters, developers | The person doing the task, when stuck | The person doing the task, every run |
The working relationship between the three is sequential. You flowchart first, because you cannot write a good procedure for a process you have not agreed. You write the SOP second, one section per box on the chart, with each decision diamond becoming an "if" clause. You build the checklist third, from the SOP, keeping only the items that need confirming and linking back to the SOP for anyone who needs the detail. How to write an SOP covers the middle stage; how to create checklists that get used covers the last.
The failure mode is trying to skip a stage. A checklist built without a flowchart tends to be linear when the process is not, so the person running it hits step 7, realises it does not apply to their case, and starts improvising. An SOP built without a flowchart tends to bury the decision points in prose where nobody finds them.
Start From a Process That Is Already Mapped
CheckFlow's template library includes ready-to-run processes for IT support, finance approvals, onboarding and change management, each already broken into steps, owners and decision points. Copy one and adapt it rather than starting from a blank page.
Browse Free TemplatesHow to Create a Process Flowchart in 8 Steps
The hard part of flowcharting is not the drawing. It is getting an accurate account of the process out of the people who perform it, and then making the decisions that the process has been quietly leaving to individual judgement. These eight steps take you from a vague sense that "we should document this" to a chart that survives contact with the team.
Fix the scope: one process, one trigger, one outcome
Write a single sentence before you draw anything: "This chart starts when [trigger] and ends when [outcome]." For an expense process that might be "starts when an employee submits a claim and ends when the payment is in their account". If you cannot write the sentence, you have not chosen a process; you have chosen a department. The most common scoping mistake is starting too wide. "Procurement" is not a process. "Raising and approving a purchase order under £5,000" is.
Identify the roles and systems involved
List every role that touches the process (requester, line manager, finance, IT service desk) and every system the work passes through (the HR platform, the ticketing tool, the ERP). Roles, not names: "Finance Approver", not "Priya". These become your swimlanes. If the list runs past six or seven, the scope is probably still too wide, or the process genuinely spans several teams and you should expect the chart to expose hand-off problems, which is fine, that is the point.
Gather the steps from the people who do the work
Sit with the practitioners, ideally while they perform the process, and write down what actually happens, including the workarounds. The service desk analyst who "just messages Dave on Teams because the form never gets picked up" has told you something the documented process does not. Ask, at every step, "what happens if that is not true?" and "what happens next?" until you reach the outcome. Do this with sticky notes on a wall or a whiteboard, one action per note; it is faster than any software and people are happier to move a sticky note than to correct a colleague's diagram.
Draw the happy path first
Lay out the sequence that happens when every decision goes the expected way, top to bottom, as a straight line of process boxes between the start and end terminators. Do not add a single branch yet. Getting the main line agreed first stops the session collapsing into an argument about edge cases before anyone has confirmed the basics. For most processes the happy path is eight to fifteen boxes.
Add decision points and exception paths
Now go back through the happy path and insert a diamond wherever the practitioners said "it depends". Write the condition as a question with a definite answer ("Claim over £500?" not "Is it large?"), label every outgoing arrow, and draw where each answer leads. Exceptions branch to the side and either rejoin the main line or exit to their own end terminator ("Claim rejected"). Every diamond must have every answer accounted for. A "no" arrow that goes nowhere is a gap in the real process, and finding those gaps is where flowcharting earns its keep.
Assign every step to a swimlane
Move each box into the lane of the role that performs it. If a box does not belong in any lane, the process has an unowned step, which is the single most common reason work stalls. If a box seems to belong in two lanes, it is two steps with a hand-off between them; split it. Count the lane crossings. Each one is a moment where the work waits for someone to notice it, and a good target for reducing.
Walk it through with real cases
Take three recent real instances of the process, one straightforward, one that went wrong, one unusual, and trace each through the chart with the team. Every time someone says "well, in that case we actually…", you have found either a missing branch or a step that is not really followed. Fix the chart or fix the process, but do not leave the two disagreeing. This is also where the chart gets tested against the acceptance criterion from step 1: does every path really start at the trigger and end at the outcome?
Publish, version and set a review date
Give the chart a title, an owner, a version number and a date. Put it where the people who follow the process will actually see it, which is usually inside the SOP or the checklist tool, not in a diagramming app's shared folder. Then set a review trigger: a fixed date (every six or twelve months) and an event ("whenever the ticketing system changes"). A chart nobody owns is out of date within a year and does more harm than no chart at all, because people trust it.
Five Process Flowchart Examples
Symbols and steps are abstract until you see them applied. The five examples below are described as sequences with their decision points so you can draw them yourself or recognise your own process in them. Each is a real pattern that appears, with local variations, in almost every 10-to-500-person company.
1. IT support ticket
Lanes: Requester, Service Desk (L1), Second Line (L2), Requester again for sign-off.
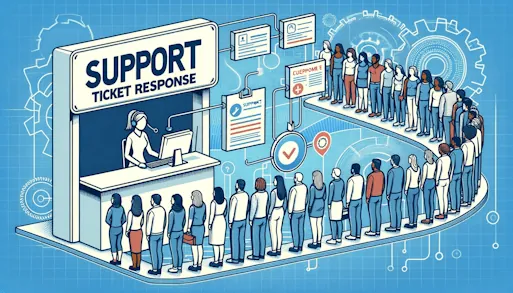
Start: "Ticket submitted via portal or email." The service desk categorises and prioritises the ticket. First decision: Is it a known issue with a documented fix? Yes leads to "Apply fix from knowledge base" and then to a second decision, Resolved? If yes, "Notify requester and request confirmation". No at either point leads to "Escalate to second line", which sits in the L2 lane. L2 investigates and hits its own decision: Fix within SLA? Yes leads back to the resolution path; no leads to "Raise a problem record and inform requester of revised ETA". The final decision sits in the Requester lane: Requester confirms resolved within 3 working days? Yes leads to the end terminator "Ticket closed"; no reopens the ticket back to the point of escalation. Notice the loop: without it, tickets get closed on the analyst's say-so, and the flowchart makes that visible. The support ticket response template is this process as a runnable checklist.
2. Employee onboarding
Lanes: HR, Hiring Manager, IT, New Starter.
Start: "Offer accepted." HR creates the employee record and issues the contract. Decision: Contract signed and references cleared? No loops to "Chase candidate / referee" with a wait; yes triggers three parallel paths, which is a case where a flowchart is clearer than any list. In the IT lane: "Create accounts", "Order and image device", and a decision, Role requires elevated access? Yes routes through "Obtain security approval" before "Grant access". In the Hiring Manager lane: "Prepare 30-60-90 day plan", "Schedule week-one meetings". In the HR lane: "Enrol in payroll and benefits". The paths converge at "Day one induction", then a decision at the end of the probation period: Probation passed? Yes ends at "Employee confirmed"; no branches to "Extend or exit", which is its own sub-process. Drawing the parallel IT and manager work side by side is what stops the laptop arriving a week after the person does.
3. Purchase approval
Lanes: Requester, Line Manager, Finance, Procurement.
Start: "Purchase request raised." Line manager reviews. Decision: Within approved budget line? No leads to "Return to requester with reason", which loops or ends at "Request declined". Yes leads to a value gate: Over £5,000? Under goes straight to Procurement's "Raise PO with preferred supplier". Over routes through Finance's "Check cash flow and budget phasing" and a second decision, Three quotes attached? No loops back to the requester to obtain them; yes goes to "Finance director approval" and then Procurement. Procurement's final decision is Supplier on approved list? Yes leads to "Issue PO" and the end terminator "PO sent"; no triggers the supplier onboarding sub-process first. This chart usually reveals that the three-quote rule is being applied inconsistently, which nobody knew until the diamond forced someone to state the threshold.
4. Incident escalation
Lanes: Monitoring, On-call Engineer, Incident Manager, Communications.
Start: "Alert fires or user reports outage." On-call engineer acknowledges within the SLA and performs a first assessment. Decision: Customer-facing impact? No leads to "Fix under normal change process" and the end "Incident logged and closed". Yes leads to the severity decision, More than one service or more than 10% of users affected? Yes declares a major incident, which hands off to the Incident Manager lane: "Open bridge call", "Assign roles". In parallel, Communications posts the first status update within fifteen minutes, then loops every thirty minutes until resolution, a timed loop that a flowchart shows and a list cannot. The engineering path has its own loop: "Attempt mitigation", then Service restored? No returns to mitigation with the option "Escalate to vendor" after a time threshold; yes leads to "Monitor for 30 minutes", "Close incident", and a mandatory "Schedule post-incident review" before the end terminator. For the change-control side of this, see the IT change management checklist.
5. Content approval
Lanes: Writer, Editor, Subject Expert, Legal, Publisher.
Start: "Draft submitted." Editor reviews for structure and tone. Decision: Ready for expert review? No returns to the writer with comments (loop, with a counter: after two returns, the editor and writer meet rather than exchanging comments a third time, which is a rule the flowchart made explicit). Yes passes to the Subject Expert lane for accuracy checks and a similar decision. Then the compliance gate: Contains claims, pricing or regulated content? No skips Legal entirely; yes routes through "Legal review" with its own approve/return decision. The Publisher lane finishes with "Schedule", "Publish", and the end terminator "Live". The chart's value here is the Legal bypass: before it was drawn, everything went to Legal and waited a week, including blog posts about office plants. The design review and approval template follows the same shape for creative assets.
What these five have in common
Every one contains at least one loop (work returning to an earlier step), at least one conditional bypass (a lane that is skipped when a condition is false), and at least one hand-off that used to be invisible. Those three features are what a linear document cannot show and what a flowchart exists to expose. They are also the three things you will need conditional logic for when you turn the chart into a checklist.
Flowchart Tools: Which Category Do You Need?
The tool matters less than people think and more than they would like. A chart drawn on a whiteboard and photographed is fine for a workshop and useless six months later. The categories below are ranked roughly by how much structure they impose; pick the lightest one that meets your need for maintenance and reuse.
Whiteboard and sticky notes
Best for the discovery workshop in steps 3 to 5. Fast, collaborative, and nobody is precious about moving a sticky note. Its weakness is obvious: it does not persist. Photograph it and redraw it the same day, before the memory of what the arrows meant fades.
General diagramming software
Diagramming tools with flowchart stencils, swimlane templates and shared editing. This is where most business flowcharts end up. They produce clean, shareable charts and are good enough for documentation and training. The limitation is that the chart is a picture: it has no idea what the boxes mean, cannot be run, and drifts out of sync with the process it describes the moment nobody is looking.
Process mapping and modelling suites
Purpose-built for BPMN and other formal notations, often with a process repository, versioning, role libraries and simulation. Appropriate for large organisations with a process-excellence function, or anywhere a process needs to be modelled precisely enough to hand to developers. Overkill for a 40-person company documenting how it approves annual leave.
Checklist and workflow platforms with a visual builder
Tools where the diagram and the executable process are the same object. You lay out steps, assign roles, add conditions, and the result is not a drawing of the process but the process itself, ready to run, with each instance tracked and recorded. CheckFlow's template designer works this way, and it is the right category when the aim of flowcharting is to get a process followed consistently rather than merely understood. The trade-off is that these tools model what a team needs to do, not every nuance of BPMN; if you need message events and compensation handlers, you need a modelling suite.
A reasonable path for most teams is whiteboard for discovery, a diagramming tool for the reference chart that goes in the SOP, and a workflow platform for the version that actually runs. The reference chart and the running version should be reconciled at every review.
Flowchart Best Practices and Common Mistakes
Most flowcharts fail for the same handful of reasons, and none of them are about artistic ability. They are about scope, honesty and maintenance. The mistakes below are the ones that show up in almost every first draft, followed by a checklist you can run against a chart before you call it finished.
Mistake: charting the policy instead of the practice. The chart is drawn from the procedure manual, or from a manager's memory of how the process is supposed to work, and it omits every workaround the team actually relies on. Practitioners look at it, recognise that it is fiction, and ignore it. The fix is to draw from observation and interview, then reconcile the chart with the policy afterwards, deciding in each case whether to change the chart or change the behaviour.
Mistake: unlabelled or non-binary decisions. A diamond that reads "OK?" with two unlabelled arrows tells the reader nothing. Every decision must be a question with a definite answer, and every outgoing arrow must carry one of those answers. If you find you need four arrows out of a diamond, ask whether it is really two decisions in sequence; if you find you cannot phrase the condition precisely, you have found a decision that is currently being made on gut feel, and the process needs a rule.
Mistake: one chart that tries to show everything. Forty boxes, six pages of off-page connectors, three levels of nested exceptions. Nobody reads it. Keep the top-level chart to one page and the happy path to fifteen boxes or fewer; push anything more detailed into a sub-process symbol and give it its own chart. The reader should be able to see the shape of the whole process at a glance and drill down only where they need to.
Mistake: no owner, no version, no review date. A chart that is right today is wrong in eighteen months, and a wrong chart is more dangerous than none because people trust it. Every chart needs a named owner, a version number and a next-review date, and the review should be triggered both by the calendar and by any change to the systems or roles the chart references.
Mistake: stopping at the chart. The process is drawn, agreed and filed, and nothing changes, because a diagram cannot assign a task or chase a deadline. A flowchart is the specification for a process, not the process. If the aim was consistent execution, the chart has to become a procedure and a running checklist; the section below covers how.
Before you sign off a flowchart
Run the finished chart against this list. Every item that fails is a defect in either the chart or the process, and it is worth knowing which.
- The start terminator names a trigger event, and every end terminator names a final state
- Every path from the start reaches an end; no box has an arrow in but none out
- Every decision is a question with a definite answer, and every outgoing arrow is labelled
- Every process box is a single verb-plus-object action performed by one role
- Every box sits in a swimlane, and every lane is a role or system, not a person
- The happy path runs straight down the page; exceptions branch to the side
- Loops have an exit condition (a time limit, a retry count or an escalation)
- The top-level chart fits on one page; detail is pushed into sub-processes
- Three real cases have been traced through it with the people who do the work
- It has an owner, a version number, a date and a scheduled review
Turning a Flowchart into an Executable Checklist
A flowchart is finished when it is agreed. It is useful when it is followed. The gap between those two states is where most process documentation efforts stall: the chart goes into the SOP, the SOP goes into the wiki, and six months later the process is being performed from memory again, with the chart serving only as evidence that someone once thought about it.
Closing the gap means converting the chart into something that runs: a checklist in which every box has become a task assigned to a role, every diamond has become a rule that shows or hides the tasks that follow, and every instance of the process produces a record of who did what and when. Modern checklist software is built for exactly this translation, and the mapping is more direct than it looks.
The translation rules
Process box becomes a task. Keep the verb-plus-object wording. Add the detail that the chart deliberately left out: the acceptance criterion, a link to the SOP section, any field that must be filled in (a ticket number, a PO value, a photo of the sealed device). One box in the chart is usually one task; occasionally it is a short group of two or three.
Swimlane becomes an assignee. Every task inherits the role of its lane. In a checklist platform that supports task assignment by role, the lane label is literally the assignment rule: everything in the "IT" lane is assigned to the IT queue, everything in the "Hiring Manager" lane to whoever is named as hiring manager when the checklist is started.
Decision diamond becomes a conditional rule. The question in the diamond becomes a form field on the preceding task ("Claim value", "Customer-facing impact: yes/no"), and each labelled arrow becomes a rule that shows the tasks on that branch and hides the others. This is the step that linear, paper checklists cannot do and the reason so many of them are ignored: a checklist that shows the Legal review items to someone writing a post about office plants teaches that person to skip items. Conditional logic in checklists explains how these rules work and how far to take them.
Loop becomes a repeatable task or a re-open. "Return to writer with comments" becomes a task that can be re-triggered, with a counter if the chart specified one. Some loops are better modelled as a status change ("Reopen ticket") than as a task; the chart tells you which by whether the loop rejoins the main line early or late.
Sub-process becomes a linked checklist. "Run supplier onboarding" becomes a task that starts the supplier onboarding checklist and, ideally, waits for it. This keeps each checklist to one page, which matters as much for execution as it did for the chart.
Timing annotations become due dates. The flowchart usually carries SLA notes in the margin: "acknowledge within 15 minutes", "confirm within 3 working days". These become dynamic due dates on the corresponding tasks, calculated from the moment the checklist started or the moment the previous task closed, so a late task is visible and can be escalated rather than quietly forgotten.
A worked conversion
Take the purchase approval example above. The checklist has four sections, one per lane. The requester's section has a form: description, supplier, value, budget line. The line manager's section has a single approve/return task. Then a rule: if value is £5,000 or less, hide the Finance section and go straight to Procurement; if over, show Finance's "check budget phasing" task and a required "three quotes attached" field, which itself gates the "Finance director approval" task. Procurement's section ends with a task that checks the supplier list and, if the supplier is new, starts the supplier onboarding checklist as a linked run. Every completed run is a record: who approved, at what value, on what date, with the quotes attached. The flowchart took two hours to agree; the conversion takes about the same again, and the process then runs itself for years.
The wider point is that this conversion is the practical heart of business process management: modelling a process, executing it, measuring it, and feeding what you learn back into the model. A flowchart that becomes a running checklist is a process under management. A flowchart in a folder is a drawing.
Free Process Templates
The fastest way to see what a flowcharted process looks like as a running checklist is to open one. The three templates below correspond to examples from this guide. Each has its steps grouped by role, its decision points expressed as conditional rules, and its hand-offs as assignments; copy it, then adjust the roles and thresholds to match your own chart.


How CheckFlow Fits
CheckFlow is business process management software built around the idea that a process should be run as a checklist, not consulted as a document. It is designed for the conversion described above: you bring a flowchart, and you leave with a process that assigns itself, branches itself and records itself.
Templates. Every process starts as a template in the template designer, with tasks grouped into sections that map naturally onto swimlanes. The library of free templates covers most of the processes in this guide, so the starting point is usually an edit rather than a blank page.
Task assignment. Each task is assigned to a named user or a role, so a lane in the chart becomes an assignment rule in the template. When a run starts, the tasks land with the right people, and the real-time dashboard shows who is holding what.
Conditional logic. Decision diamonds become rules in CheckFlow's automations: a form field on one task controls which tasks appear next. The Legal bypass, the value gate, the elevated-access approval, all of the branching from the examples above, are expressed as show/hide rules rather than as instructions the reader has to interpret.
Dynamic due dates. SLA annotations from the chart become due dates calculated relative to the run start or a previous task's completion, so "acknowledge within 15 minutes" and "confirm within 3 working days" are enforced rather than hoped for.
Recurring schedules. Processes that run on a cadence, month-end close, quarterly access reviews, weekly maintenance, can be scheduled so a new run is created automatically without anyone remembering to start it.
Real-time dashboard and audit trail. Every run records who completed each task, when, and what they entered. Analytics and reporting show where runs stall, which is how you find the hand-off in the chart that needs redesigning, and the audit trail is the evidence when someone asks whether the process was followed.
Zapier and API. Integrations let a run be started by an event in another system, a new hire in the HR platform, a ticket in the service desk, a form submission, so the trigger in your start terminator can be literal.
Pricing starts at $10 per user per month, with a 14-day free trial and no credit card required. Details are on the pricing page.
Turn Your Flowchart into a Running Process
Bring the chart you have just drawn. Build it as a template with assigned tasks, conditional branches and due dates, run it with your team, and see the record of every instance. Free for 14 days, no credit card.
Start Your Free TrialFrequently Asked Questions
What is a process flowchart?
A process flowchart is a diagram that shows the steps of a business process in order, using standard symbols: rounded rectangles for the start and end, rectangles for actions, diamonds for decisions, and arrows for the path the work takes. It has one trigger, at least one outcome, and every route between them is traceable.
Teams draw them to agree how a process really works, to find waste and unowned steps, to train new staff, and as the specification for building the process into software. A swimlane version adds rows for each role, which makes hand-offs between teams visible.
What are the basic flowchart symbols?
The core set is small: a terminator (rounded rectangle) for start and end, a process (rectangle) for an action, a decision (diamond) for a yes/no or multi-way question, an input/output (parallelogram) for data crossing the process boundary, a document symbol for artefacts, connectors for jumping between parts of a page, and a sub-process symbol for a step documented on its own chart.
Swimlanes are not a symbol as such but a layout: horizontal or vertical bands, one per role or system. The full standard, ISO 5807, defines many more shapes, but most business flowcharts need only these eight, and using more tends to reduce readability rather than add precision.
What is the difference between a flowchart and a process map?
In everyday use the terms overlap heavily. Strictly, process mapping is the activity of discovering and documenting how work flows through an organisation, and a flowchart is one output of that activity, usually a single process drawn with standard symbols. A process map may be higher level, showing how several processes relate, or may use other formats such as SIPOC or value stream maps.
A useful rule of thumb: if it has diamonds and labelled arrows and covers one process from trigger to outcome, call it a flowchart. If it shows the landscape of processes, their inputs and outputs, or adds timing and volume data, it is a process map of some other kind.
How do you make a flowchart for a business process?
Fix the scope in one sentence (starts when X, ends when Y), list the roles and systems involved, and gather the steps from the people who actually perform the process, including their workarounds. Draw the happy path first as a straight line of actions, then add decision diamonds wherever the answer is "it depends", labelling every outgoing arrow.
Move each step into the swimlane of the role that does it, trace three real cases through the chart with the team to catch gaps, then publish it with an owner, a version number and a review date. Most business processes fit on one page with eight to fifteen steps on the main path.
What is a swimlane flowchart used for?
A swimlane flowchart divides the page into bands, one per role, department or system, and places each step in the band of whoever performs it. It is used for any process that crosses team boundaries, such as onboarding (HR, IT, hiring manager), purchase approval (requester, manager, finance, procurement) or incident response (engineering, incident manager, communications).
Its particular value is that every arrow crossing a lane boundary is a hand-off, and hand-offs are where work waits, information is lost and responsibility blurs. Counting and reducing lane crossings is one of the quickest process improvements available, and the lanes translate directly into task assignments when the process is built as a checklist.
What is the difference between a flowchart and BPMN?
BPMN (Business Process Model and Notation) is a formal standard with a much larger vocabulary than a basic flowchart: distinct symbols for start, intermediate and end events, several kinds of gateway, message and timer events, pools and lanes, and rules for how they combine. BPMN 2.0 also defines execution semantics, so a compliant model can be run by a process engine.
A basic flowchart is simpler, faster to draw and easier for non-specialists to read. Use BPMN when the model will feed a process engine or needs to be simulated; use a basic or swimlane flowchart when the audience is the team that performs the process and the goal is agreement, training or a specification for a checklist tool.
How do you turn a flowchart into a checklist?
Each process box becomes a task with the same verb-plus-object wording, plus any acceptance criterion or required field. Each swimlane becomes the assignee for the tasks inside it. Each decision diamond becomes a form field on the preceding task and a conditional rule that shows the tasks on the chosen branch and hides the others. Sub-processes become linked checklists, and SLA notes become due dates relative to the run start.
Done in checklist software with conditional logic and task assignment, the result is a process that starts on a trigger, routes itself, chases its own deadlines and records who did what on every run. On paper, only the linear happy path can be captured, which is why printed checklists for branching processes tend to be ignored.