
Will the business hit its plan this year?
Method: usually indirect, starting from the P&L.
Horizon: the financial year, in months.
Built from: revenue and cost drivers, headcount and capex plans.
Profit forecasts tell you whether the business is heading in the right direction. A short-term cash forecast tells you whether you can make payroll in week seven. The standard tool is a rolling 13-week forecast, built directly from receipts and payments and updated every week. The spreadsheet is rarely the weak point. The weak point is the weekly routine: actuals not locked in, variances not explained, and the same optimistic customer receipt forecast for the fourth week running. This free cash flow forecast checklist gives CFOs, treasurers, controllers and finance managers a repeatable weekly process. It locks last week’s actuals, reviews variances, updates receipts and payments from the ledgers, tests headroom against your minimum cash buffer and gets the forecast approved before it goes to leadership or lenders. If any week falls below the buffer, a shortfall action plan appears automatically.
Thirteen weeks is one quarter. It is long enough to include a full payroll cycle, the next round of tax payments, loan repayments and quarterly bills, and short enough to forecast receipts customer by customer and payments supplier by supplier. Each week the oldest week drops off, actual figures replace the forecast, and a new week thirteen is added at the end.
A 13-week forecast uses the direct method: it lists the cash expected in and out, rather than starting from profit and adjusting for working capital. That makes it the tool lenders and boards ask for when liquidity is tight, and a useful input when management assesses going concern. It doesn’t replace the budget or the monthly reforecast. It answers a different question.
Method: usually indirect, starting from the P&L.
Horizon: the financial year, in months.
Built from: revenue and cost drivers, headcount and capex plans.
Method: direct receipts and payments.
Horizon: the next 13 weeks, rolled forward weekly.
Built from: bank balances, the AR ageing, the AP ledger, payroll and tax calendars and loan schedules.
Six weekly phases take the forecast from last week’s actuals to an approved update. A seventh phase appears only when a week falls below your minimum cash buffer.
Shown only when a week falls below the minimum cash buffer. In a normal week this phase stays hidden.
Each line in the forecast should have a data source and an owner. When a line has neither, it tends to be copied forward from last week unchanged, and that is where most forecast errors start. Use the table to assign the lines in your own model.
| Forecast line | Source | Owner | Method |
|---|---|---|---|
| Opening cash | Bank statements | Treasury or finance | Actual balance, never a forecast |
| Customer receipts | AR ageing, sales pipeline | Credit control | Invoice by invoice for weeks 1–4, then run-rate adjusted for known timing |
| Other receipts | Tax, asset sale and financing records | Finance | Only when the date is reasonably certain |
| Payroll and payroll taxes | Payroll calendar | Payroll | Exact pay dates and amounts |
| Supplier payments | AP ledger, purchase orders | Accounts payable | Payment run dates for approved invoices, plus committed spend |
| Tax payments | Tax calendar | Tax or finance | Statutory due dates |
| Rent, leases and debt service | Contracts and loan schedules | Treasury | Contractual dates and amounts |
| Capex and one-offs | Approved capex list | FP&A | Approved items only, on expected payment dates |
Measuring forecast accuracy. A forecast earns trust by being right, and you can only tell whether it is by measuring. Each week, compare the actual closing cash with what the forecast predicted one week earlier and four weeks earlier, and record both differences. The one-week figure shows whether the near-term detail is reliable. The four-week figure shows whether the assumptions further out, such as customer payment behaviour and run-rate costs, are biased. Most forecasts that go wrong are consistently optimistic about receipts rather than randomly wrong, and a simple accuracy log makes that pattern visible within a couple of months. Set a tolerance that makes sense for your business and treat a breach as a reason to revisit the assumption, not as a one-off miss. Phase 2 of the checklist records these figures every week, so the trend builds up without anyone maintaining a separate tracker.
Forecasts and going concern. Directors and management must assess whether the business is a going concern when they prepare financial statements, and a cash forecast is usually central to that assessment. The minimum period differs by framework. IFRS requires management to look at least twelve months from the end of the reporting period (currently in IAS 1, moving to IAS 8 when IFRS 18 takes effect in 2027). US GAAP (ASC 205-40) looks one year from the date the financial statements are issued or available to be issued. UK FRS 102 requires at least twelve months from the date the financial statements are authorised for issue. A 13-week forecast covers only the start of any of these periods, so pair it with a longer monthly forecast when going concern is in question.
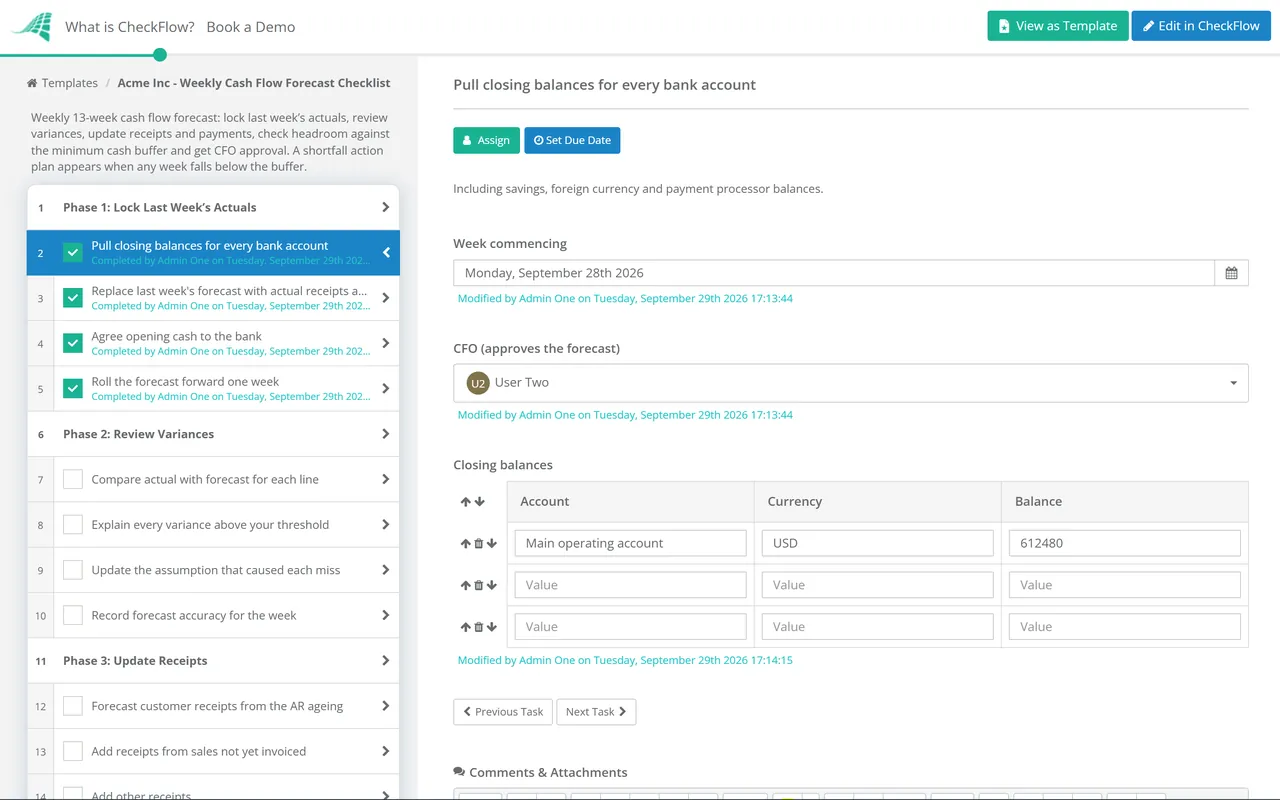
A recurring weekly schedule creates the checklist and assigns actuals, receipts, payments and review to the right people. A week that is skipped shows as overdue, rather than as a forecast that quietly went stale.
When the headroom check shows a week below your minimum buffer, the shortfall action plan appears with owners and an approval step. The response to a cash problem is decided and tracked in the same place the problem was found.
Variance explanations, the approved forecast and the decisions taken are attached to each week’s checklist. When a lender, the board or your auditors ask how the forecast has performed, the history is already there.
A forecast has to be rebuilt from fresh data every week, and that is exactly what CheckFlow’s recurring checklist software is designed for: the same steps, on the same day, with the same owners, and a record of every run.
The forecast depends on the ledgers behind it. The Accounts Receivable & Collections Checklist produces the collections forecast, the Accounts Payable Process Checklist sets the payment runs, and the Annual Budget Planning Checklist sets the plan the forecast is measured against.

Accounts Receivable & Collections Checklist

Accounts Payable Process Checklist
Annual Budget Planning Checklist

Budget Variance Review Checklist

Monthly Management Reporting Pack Checklist
Describe the process in a sentence and the AI checklist generator drafts the phases and tasks for you.
It is a rolling forecast of cash receipts and payments for the next thirteen weeks, built with the direct method and updated every week. Each update replaces the oldest week with actual figures and adds a new week at the end. It is the standard short-term liquidity tool for finance teams, and the one lenders and boards usually ask for when cash is tight.
A 13-week forecast should be updated weekly, on the same day each week. The value comes from the routine: locking actuals, explaining variances and correcting the assumptions that were wrong. A forecast updated monthly misses most of the timing differences that decide whether a particular week is tight.
The direct method lists actual cash receipts and payments: customer receipts, payroll, supplier payments, tax and so on. The indirect method starts from profit and adjusts for non-cash items and working capital. Short-term forecasts use the direct method because it can be checked line by line against the bank. Longer-term forecasts and budgets usually use the indirect method.
Most variances are timing: a customer paying a week late, a supplier run moved, a tax payment falling on a different day. The rest come from forecasting receipts too optimistically, missing one-off payments such as annual insurance, or copying lines forward without checking them. Classifying each variance as timing or permanent in the weekly review shows which assumptions need to change.
There is no universal figure. Many businesses set the buffer as a number of weeks of fixed costs, often including at least one full payroll, and adjust it for how volatile their receipts are and how quickly they can draw on funding. Whatever figure you choose, write it into your treasury policy so the forecast is tested against the same threshold every week.
Not on its own. Going concern assessments look further ahead: at least twelve months from the reporting date under IFRS, one year from the date the financial statements are issued under US GAAP, and at least twelve months from the date of approval under UK FRS 102. The 13-week forecast gives reliable detail for the first quarter of that period, and a longer monthly forecast covers the rest.
14-day free trial, no card required. The Business plan is $10 per user per month after the trial. Full details at checkflow.io/pricing.
14-day free trial, no credit cardFull refund in your first 30 daysUS hosting, EU on request